
Measuring AI Productivity in Engineering Teams: Why Lines of Code and PR Count Lie
Your team adopted AI coding tools. Pull requests went up 40%. Lines of code went up even more. Your CFO is delighted. And yet releases don't feel faster, bugs don't feel rarer, and your best engineer spends half her day reviewing code that "looked fine."
You're not imagining it. Output went up. That's not the same as productivity going up.
The short answer: to measure whether AI is really making an engineering team more productive, stop counting lines of code and pull requests. Track delivery outcomes instead: DORA metrics (deployment frequency, lead time, change failure rate, recovery time), plus first-pass acceptance rate, rework and review time. Then compare them in a fair before-and-after test.
This guide is for CTOs, VPs of Engineering, and the CEOs and CFOs signing off on AI tool budgets. It covers what the research says (spoiler: it disagrees with itself), which metrics hold up, how to run a six-week test, and what to put on the board slide.
What the research says, and where it disagrees
If you've read two articles about AI productivity, you've probably read two opposite conclusions. Both can be true at once. Here's the evidence that matters, with its limits.
|
Source |
What it found |
The catch |
|---|---|---|
|
DORA 2025 State of AI-assisted Software Development (Sep 2025, ~5,000 professionals) |
About 90% use AI at work. AI adoption now links to higher delivery throughput, but delivery instability keeps rising. DORA calls AI "an amplifier" of what's already strong or weak in a team |
Survey data, so it shows correlation, not cause |
|
METR randomized trial (Jul 2025, 16 developers, 246 tasks) |
Experienced open-source developers were 19% slower with AI tools, even though they believed they were about 20% faster |
Small sample, early-2025 tools, mature codebases they knew well |
|
METR follow-up (Feb 2026, 57 developers, 800+ tasks) |
Estimated speedups of 18% for returning developers and 4% for new ones, with wide confidence intervals |
METR itself calls this "very weak evidence": some developers refused to work without AI, and 30–50% held back tasks they didn't want to do without it |
|
Stack Overflow Developer Survey (Oct 2026, 30,000+ respondents) |
66% use coding agents, and 73% of AI users use them daily. Only 20% use AI to deploy or run production systems |
Usage is not the same as impact |
|
Liu et al., arXiv (Apr 2026, 302,600 AI-authored commits) |
22.7% of issues AI introduced were still in the code at the latest revision. Security issues were introduced about 1.5 times as often as they were fixed |
Measures quality, not speed, but quality is part of the bill |
What this adds up to: AI clearly speeds up some work, especially first drafts and familiar tasks. Whether it speeds up a team's delivery depends on what happens after the code is written: review, testing, rework and production stability. That's exactly the part output metrics don't see.
And the most uncomfortable finding is METR's first one: developers felt faster while being slower. If your measurement plan is "ask the team how it feels," you're measuring vibes.
Why lines of code and PR count lie
Measuring an AI-assisted team by lines of code is like measuring a restaurant by how many plates leave the kitchen. Great number. Until you check how many came back.
The Thoughtworks Technology Radar (April 2026) put "coding throughput as a measure of productivity" in its Caution ring and warned that "when these coding throughput metrics are used in isolation, they can negatively shape employee behavior" (Thoughtworks Radar Vol. 34). Here's why output metrics break down when AI writes the code:
- AI makes code cheap to produce. Counting something that just got cheap tells you how much you produced, not how much value you shipped. More code can also mean more to review, test and maintain.
- The work moves, it doesn't disappear. Time saved writing code often shows up later as review time, debugging and rework. A metric that only counts the first step misses the rest.
- People optimize for what you measure. Reward pull request count and you'll get smaller, more frequent pull requests. That's not always bad, but it's not productivity either.
- It hides quality debt. Code that ships fast and gets quietly patched for three weeks looks great on a throughput chart.
There's also a subtler problem. When a developer runs several AI agents at once, even "hours worked" stops meaning much. METR found time tracking unreliable for exactly this reason. So you need metrics that look at what reaches users, not at what happens at the keyboard.
The metrics that hold up
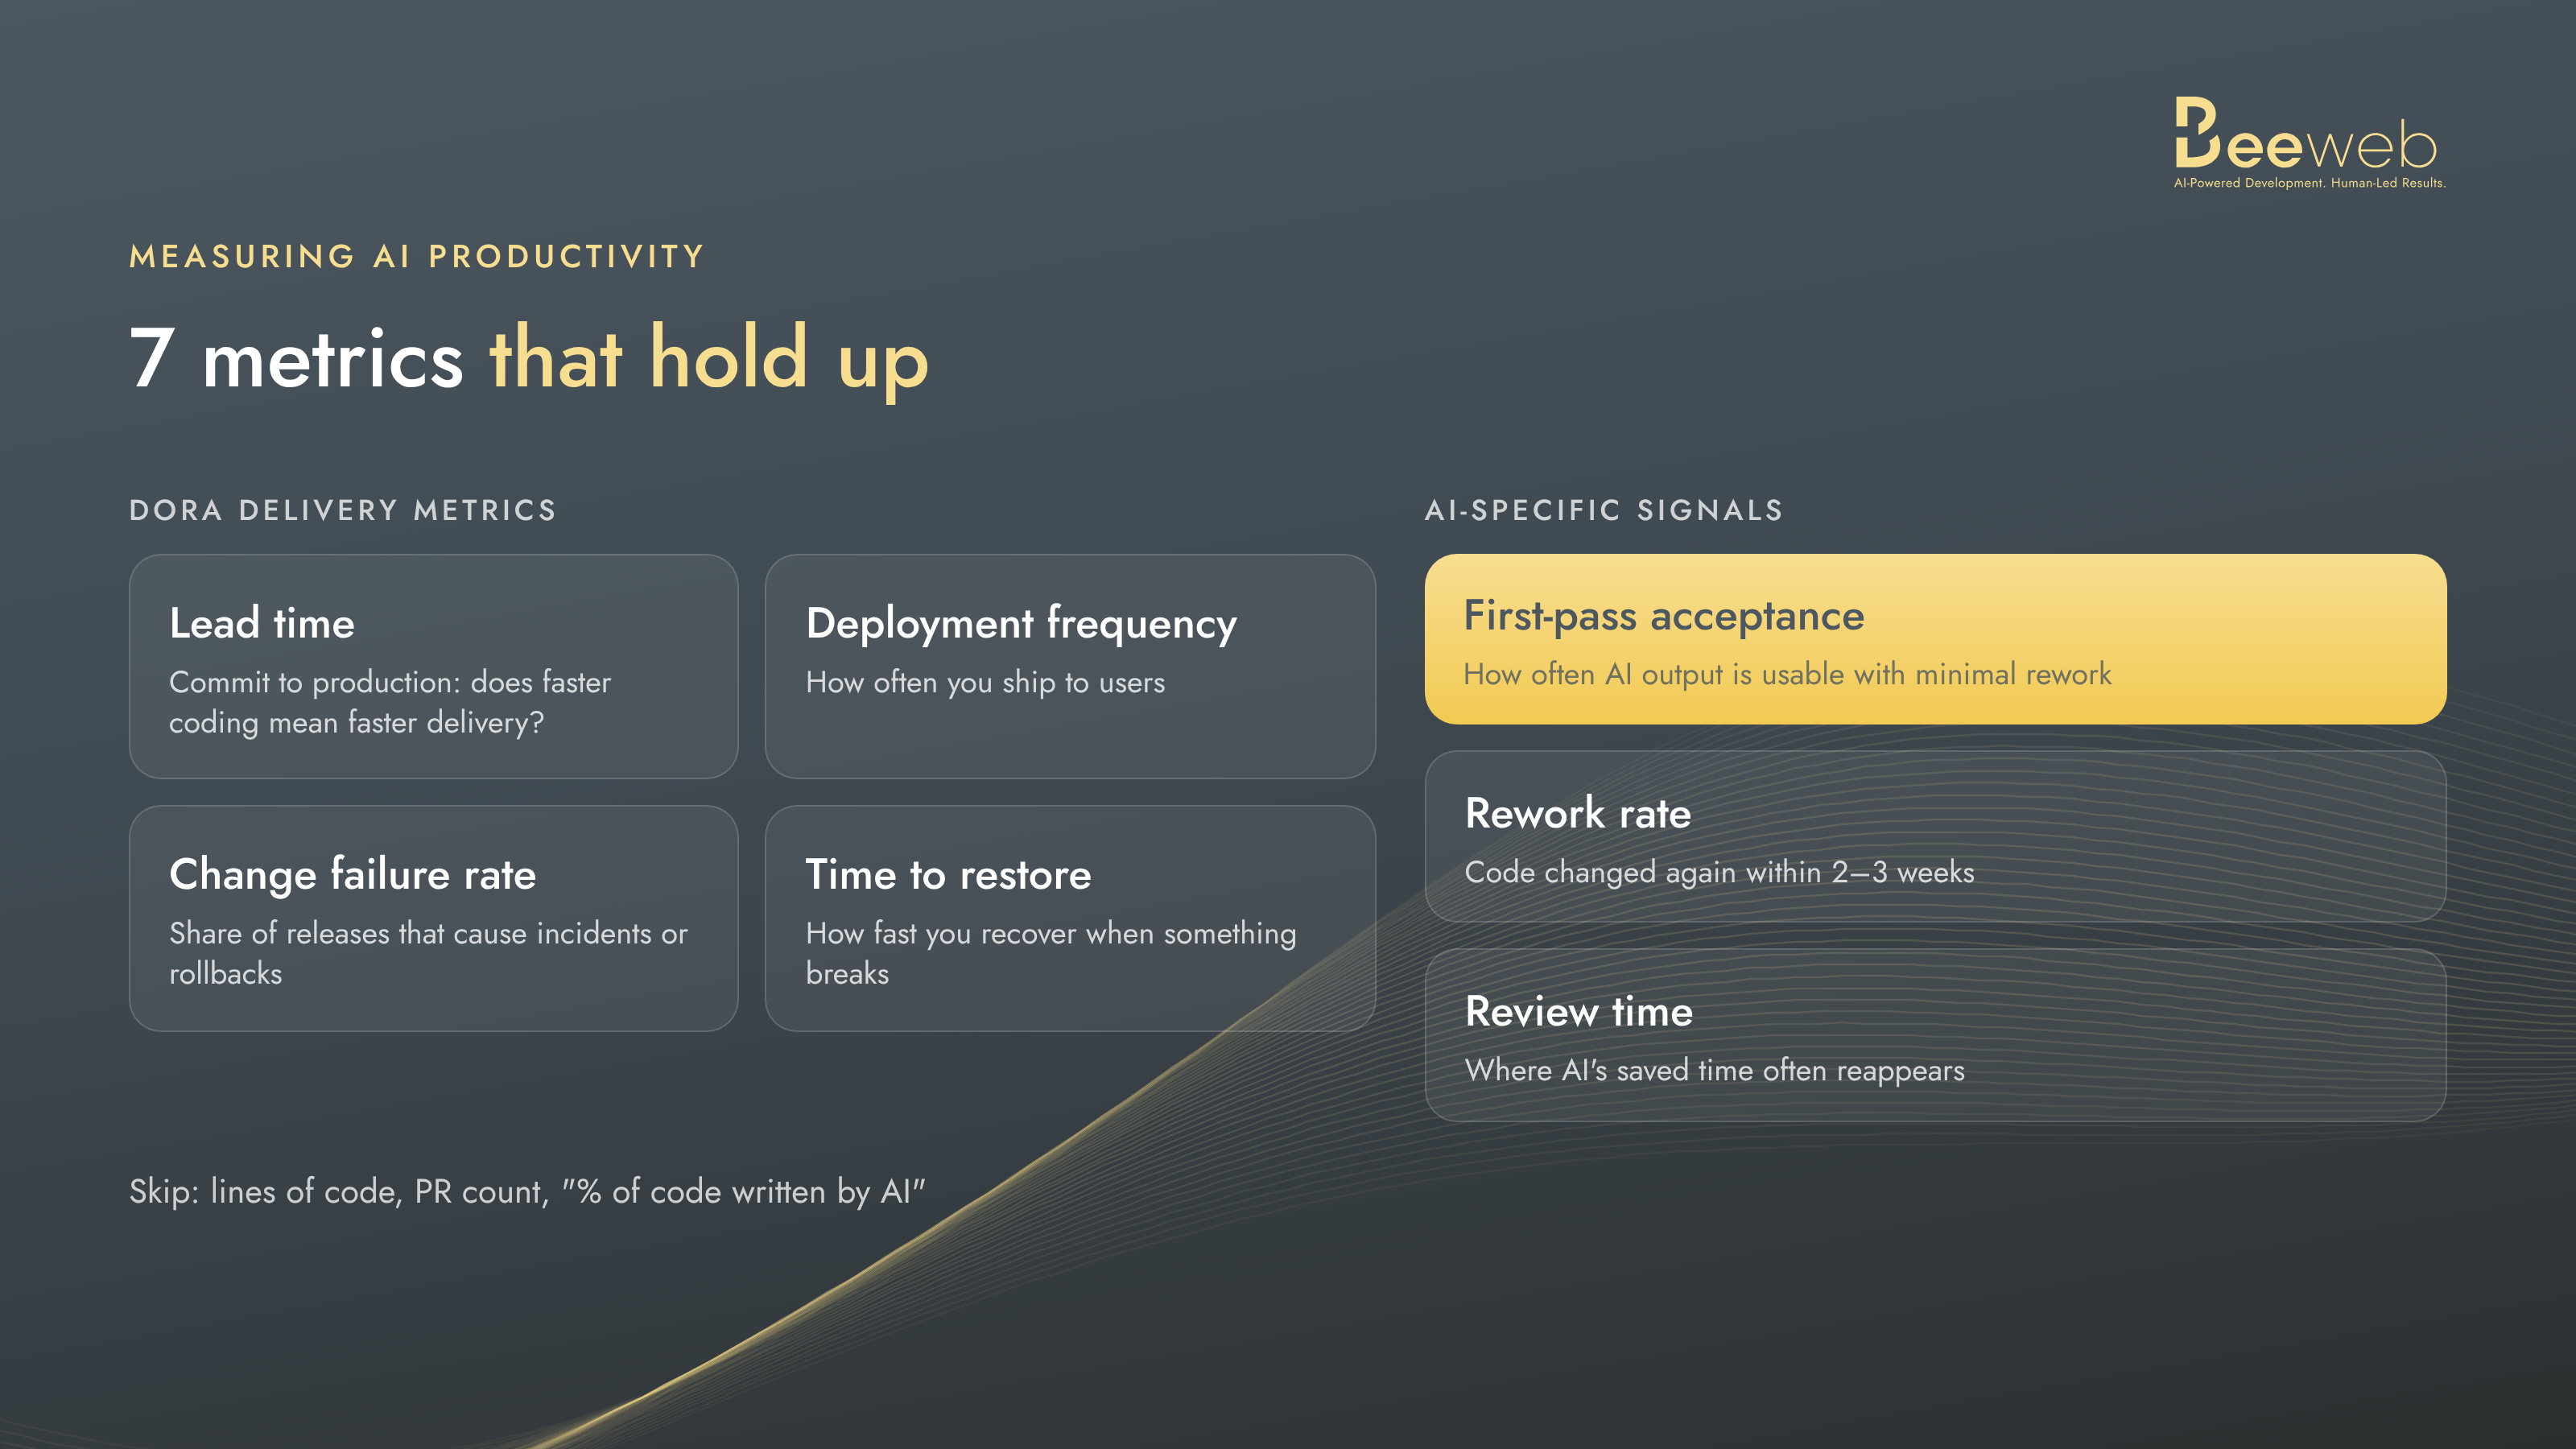
The good news: you don't need a new framework. DORA's four delivery metrics are in the Adopt ring of the Thoughtworks Radar because they "have proven to be strong leading indicators of how a delivery organization is performing." Add three AI-specific measures on top and you have a scorecard that's hard to game.
|
Metric |
What it tells you |
Why it matters with AI |
How to measure it |
|---|---|---|---|
|
Lead time for changes |
How long from first commit to running in production |
Shows whether faster coding becomes faster delivery |
Commit and deploy timestamps from Git and CI/CD |
|
Deployment frequency |
How often you ship to users |
More output should mean more frequent, smaller releases |
Count of production deploys per week |
|
Change failure rate |
Share of releases that cause an incident, rollback or hotfix |
DORA 2025 found instability rising alongside throughput |
Incidents and rollbacks divided by deploys |
|
Time to restore |
How fast you recover when something breaks |
AI-written code you don't fully understand can be slower to debug |
Incident open to resolved time |
|
First-pass acceptance rate |
How often AI output is usable with minimal rework |
The best single signal of whether AI is saving or shifting work |
AI-assisted PRs merged with no major changes, divided by all AI-assisted PRs |
|
Rework rate |
Share of recently written code that's changed again within 2–3 weeks |
Catches code that shipped fast and got patched quietly |
Lines or files modified within 21 days of being added |
|
Review time |
How long PRs wait for and spend in review |
Review is often where AI's saved time reappears |
PR opened to approved, from your Git platform |
If you track only one new number, make it first-pass acceptance rate.
First-pass acceptance and rework, explained
First-pass acceptance rate is how often AI-generated output can be used with minimal rework. Thoughtworks describes it in exactly those words in its April 2026 Radar. In practice, it answers one question: when the AI does the first draft, how often is that draft actually good enough?
A simple way to track it:
- Label AI-assisted pull requests. Most teams use a PR template checkbox or a label like
ai-assisted. - At merge, a reviewer marks the PR as accepted (minor fixes only) or reworked (significant changes to logic, structure or tests).
- Divide accepted by total, weekly.
There's no universal "good" number yet, and anyone quoting one is guessing. What matters is the trend and the pattern. Low acceptance on one part of the codebase usually means the AI is missing context there: unclear specs, no examples, or messy code it's copying from.
Rework rate is the other half. It catches code that passed review and still needed fixing soon after. If acceptance looks great but rework climbs, your reviewers are approving too fast. That's a very human response to a 400-line PR at 6 p.m. on a Friday.
Together, these two numbers tell you whether AI is saving work or just moving it downstream to your most expensive people.
How to run a fair 6-week test
You don't need a research lab to get a useful answer. You need a baseline, a clear setup and the discipline not to call it after week one.
- Weeks 0–2: get a baseline. Pull the last 8–12 weeks of DORA data from Git, CI/CD and your incident tool, before changing anything. If you can't get this, fixing your measurement is step one, and it's useful no matter what AI does.
- Week 2: define the setup. Decide which teams or projects use which tools and how. Write down the rules: what AI is allowed to touch, who reviews it, and how PRs get labeled. Compare similar work. A greenfield prototype and a 10-year-old billing system won't tell you anything useful side by side.
- Weeks 2–6: run it. Track the seven metrics weekly. Add a short weekly pulse survey (two questions: "what slowed you down?" and "where did AI help or hurt?"). Surveys don't replace data, but they explain it.
- Week 6: compare and read the trade-offs. Look at the metrics together, not one at a time. Faster lead time with a rising change failure rate is not a win. It's a loan.
- Decide what to scale. In our experience, AI helps clearly in some areas (tests, boilerplate, migrations, documentation) and costs time in others (complex business logic, unfamiliar code). Scale the first, add guardrails to the second.
Two traps to avoid. First, don't run the test during a crunch or a holiday month, because seasonal noise will drown the signal. Second, don't let the team grade its own homework. METR's 2025 trial showed that how fast developers feel and how fast they are can point in opposite directions.
What to report to the board
Boards and CFOs don't want seven metrics. They want to know three things: is it working, what does it cost, and what's the risk? One slide, four lines:
- Delivery speed: lead time and deployment frequency, before vs after. "Features reach customers X% faster."
- Quality and stability: change failure rate and time to restore. "We're shipping faster without breaking more," or, if it's true, "we're shipping faster and breaking more, and here's the fix."
- Cost: AI tool and token spend per engineer per month, set against the time saved. The Stack Overflow 2026 survey found 38% of organizations already use usage limits to control AI costs, so expect this question.
- Risk: first-pass acceptance and rework trends, plus any security findings in AI-written code.
What not to report: lines of code, number of PRs, or "percent of code written by AI." They sound impressive and invite exactly the wrong follow-up question: "So why do we still need this many engineers?" The accurate answer is that AI moved the bottleneck from writing code to reviewing, integrating and owning it. Your metrics should show that, not hide it.
Measure it before you scale it
AI coding tools are useful, and they're here to stay. They're also very easy to fool yourself with. The teams getting real value aren't the ones generating the most code. They're the ones who know exactly what reaches production, how often it breaks, and how much rework sits behind every "done."
At BeeWeb, our engineers work with AI every day, and we measure delivery the same way we've described here, because our clients care about features that work, not about how many lines we wrote. If you're deciding whether to scale AI in your team, or to extend it with engineers who already work this way, let's talk.
Book a 30-minute call with our CTO
FAQ
How do you measure AI developer productivity? Measure delivery outcomes, not output. Track DORA metrics (lead time, deployment frequency, change failure rate, time to restore) plus first-pass acceptance rate, rework rate and review time. Compare them over a 6-week test against a baseline taken before the change.
Does AI make developers more productive? The evidence is mixed. DORA 2025 links AI adoption to higher throughput but also rising instability. A 2025 METR trial found experienced developers were 19% slower with AI, while METR's 2026 follow-up suggests speedups but calls its own data weak. Results depend heavily on the team, the codebase and how AI is used.
What is first-pass acceptance rate? It's the share of AI-generated output that can be used with minimal rework. Thoughtworks recommends it over coding throughput metrics because it shows whether AI is saving work or shifting it to review and fixes.
Why are lines of code a bad productivity metric? AI makes code cheap to produce, so counting it measures volume, not value. More code can mean more to review, test and maintain, and teams quickly learn to optimize for whatever number you track.
How do you calculate the ROI of AI coding tools? Compare the monthly cost of tools and tokens per engineer against measured changes in lead time, failure rate and rework. Count review and debugging time as part of the cost, since that's often where AI's saved time reappears.